Random Process and Linear Algebra: Unit II: Two-Dimensional Random Variables,,
Regression
Regression is a mathematical measure of the average relationship between two or more variables in terms of the original limits of the data.
REGRESSION
i. Regression
Regression
is a mathematical measure of the average relationship between two or more
variables in terms of the original limits of the data.
ii. Lines of
regression
(a)
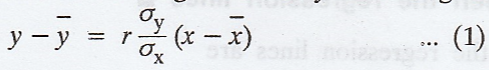
The line of regression of y on x is given by
(b)
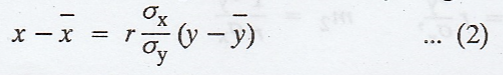
The line of regression of x on y is given by
Note: Both the lines of regression passes
through 
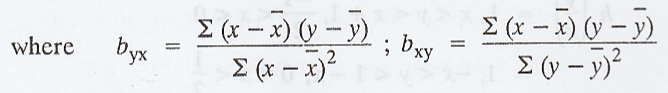
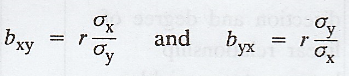
iii. Regression
coefficients
(a)
Regression coefficient of y on x is 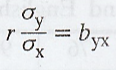
(b)
Regression coefficient of x on y is 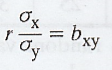
Correlation
coefficient 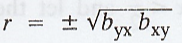
iv. Properties of
Regression Lines
(a)
The regression lines pass through  is the point of intersection
of the regression lines.
is the point of intersection
of the regression lines.
(b)
When r = 1, that is when there is a perfect, +ve correlation or when r = -1,
that is when there is a perfect -ve correlation the equation (1) and (2)
becomes one are the same and so the regression lines coincide
(c)
When r = 0 the equations of the lines are y = ȳ and x = ![]() which
represent perpendicular lines which are parallel to the axis.
which
represent perpendicular lines which are parallel to the axis.
(d)
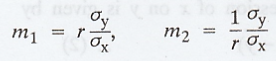
The slopes of the lines are 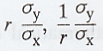
Since
the S.D's σx and σy are +ve, both the slopes are +ve if r
is +ve and -ve if r is -ve. That is all the three, namely the two slopes and r
are of same sign.
v. Angle between the
regression lines
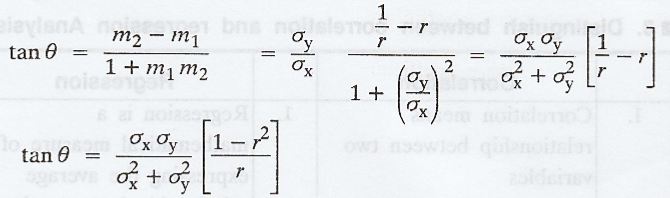
The
slopes of the regression lines are
If
is the angle between the lines, then
When will the two regression lines
be (a) at right angles (b) Coincident? [A.U N/D 2012] [A.U
A/M 2019 (R13) PQT]
Note: 1. When
r = 0, that is, there is no correlation between x and y.
tan
θ = ∞ (or) θ = π/2 and so the regression lines are perpendicular
2.
When r 1 or -1, that is, when there is a perfect correlation, +ve or -ve, θ = 0
and so the lines coincide.
vi. Correlation
coefficient is the geometric mean between the two regression coefficients
Proof :
We
know that,
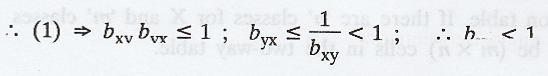
vii. If one of the
regression coefficient is greater than unity the other must be less than unity.
Proof :
We
know that, r2 = bxy byx ≤ 1 .............(1)
Assume
that bxy > 1
we
have, to prove that byx < 1
viii. Distinguish
between correlation and regression Analysis

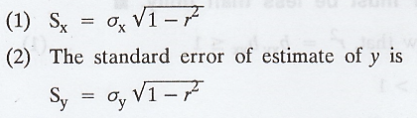
ix. Standard errors
of estimate
The
standard error of estimate of x is
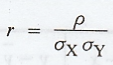
x. Correlation of
Grouped data
When
the number of observations is large and the variables are grouped, the data can
be classified into two way frequency distribution called a correlation table.
If there are 'n' classes for X and 'm' classes for Y, there will be (m x n)
cells in the two-way table.
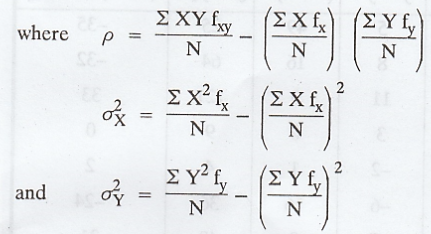
The
formula for calculating the co-efficient of correlation is
xi. Probable Error of
correlation co-efficient
The
probable error of correlation co-efficient is given by,
P.E.
(r) = 0.6745 × S.E.
where
S.E. is the standard error and is S.E. (r) =  where 'r' is the correlation
co-efficient and 'n' is the number of observation.
where 'r' is the correlation
co-efficient and 'n' is the number of observation.
Thus 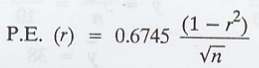
The
reason for taking the factor 0.6745 is that in a normal distribution, the range
µ = ± 0.6745 covers 50% of the total area. This error enables us to find the
limits within which correlation co-efficient can be expected to vary.
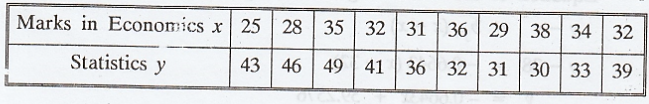
Example 2.3.1
From
the following data, find (i) the two regression equations, (ii) the coefficient
of correlation between the marks in Economics and statistics, (iii) the most
likely marks in Statistics when marks in Economics are 30. [A.U M/J 2007]
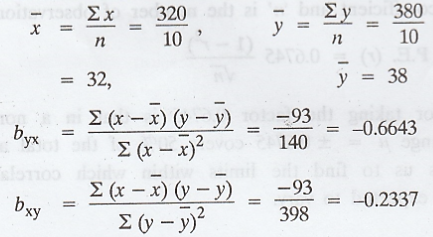
Solution :
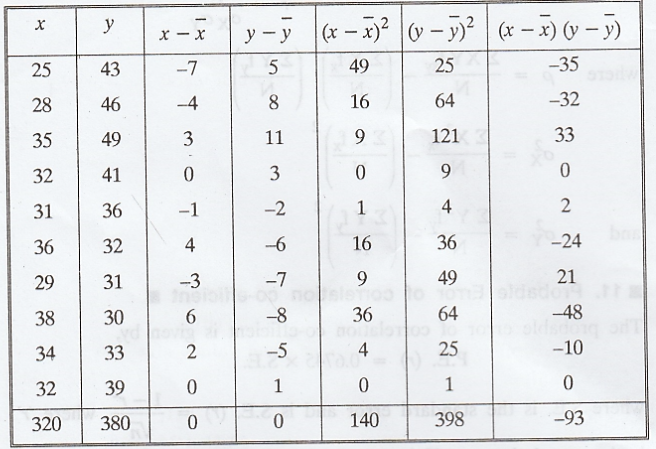
(i)
Equation of the line of regression of x on y is
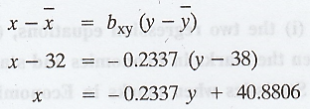
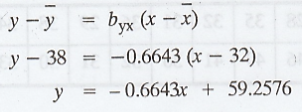
Equation
of the line of regression of y on x is
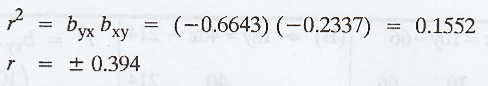
(ii)
Co-efficient of correlation
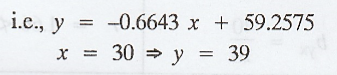
(iii)
The most likely marks in statistics (y) when marks in Economics (x) are 30
Example 2.3.2
The
two lines of regression are
 The
variance of x is 9. Find (i) The mean values of x and y (ii) Correlation
co-efficient between x and y [AU N/D 2008] [A.U CBT M/J 2010, CBT N/D 2011, CBT
A/M 2011] [A.U A/M 2015 (RP) R13] [A.U M/J 2015 R13 PQT] [A.U M/J 2016 R13 RP]
The
variance of x is 9. Find (i) The mean values of x and y (ii) Correlation
co-efficient between x and y [AU N/D 2008] [A.U CBT M/J 2010, CBT N/D 2011, CBT
A/M 2011] [A.U A/M 2015 (RP) R13] [A.U M/J 2015 R13 PQT] [A.U M/J 2016 R13 RP]
Solution :
(i)
Since both the lines of regression passes through the mean values ![]() and
and ![]() , the point
, the point  must satisfy the two regression lines
Hence
the mean values are given by 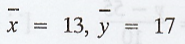
Since
both the regression coefficients are positiver must be positive r = 0.6.
Example 2.3.3
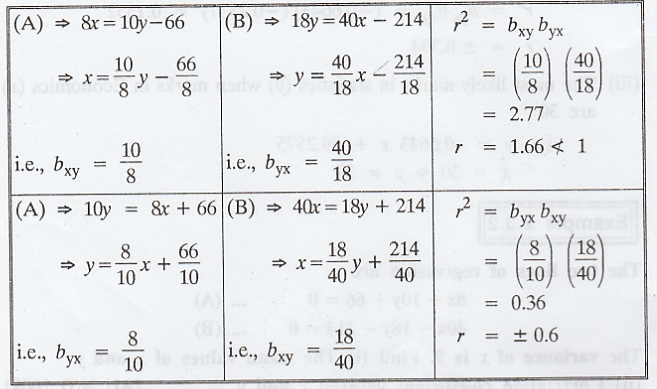
The
following table gives according to age x, the frequency of marks. obtained 'y'
by 100 students in an intelligence test. Measure the degree of relationship
between age and intelligence test.
The
origin is taken as 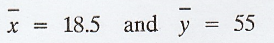
fy
-> sum of the each row
fx
-> sum of the each column
fxy
-> Given frequency
N
= ∑ fx = ∑ fy = 100
In
each cell upper values are fxy (given), middle are XY, lower are XYfxy,
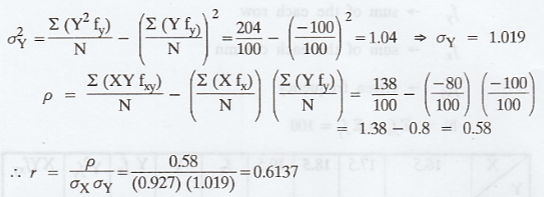
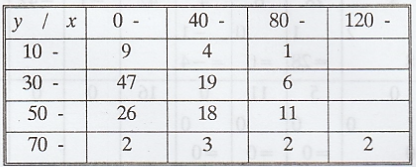
Example 2.3.4
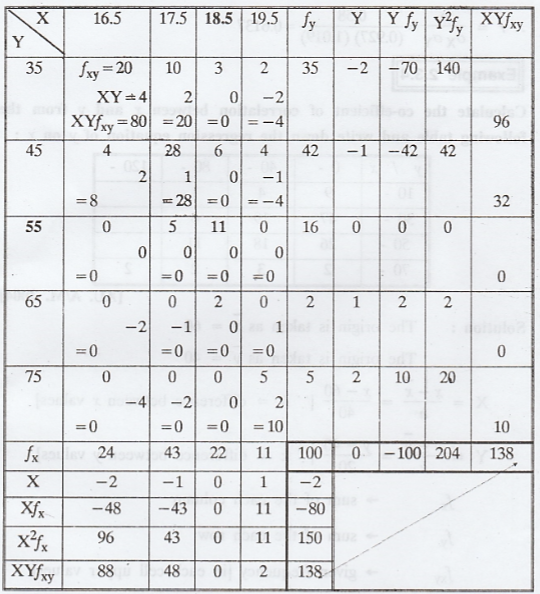
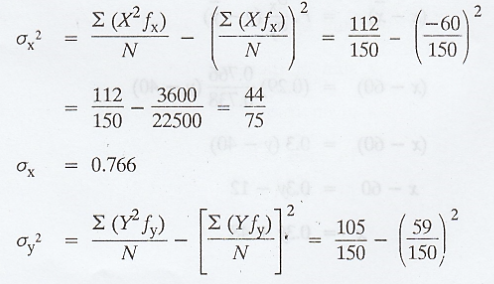
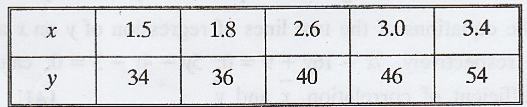
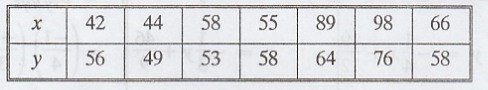
Calculate
the co-efficient of correlation between x and y from the following table and
write down the regression equation of y on x :
 [AU. A/M. 2004]
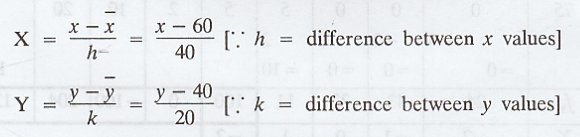
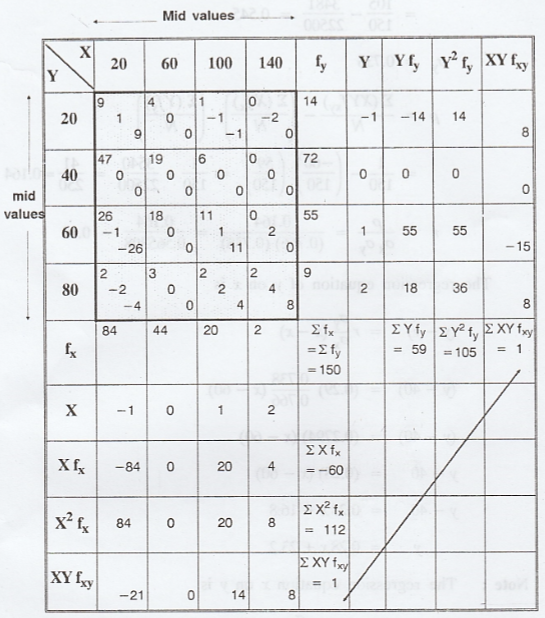
Solution :
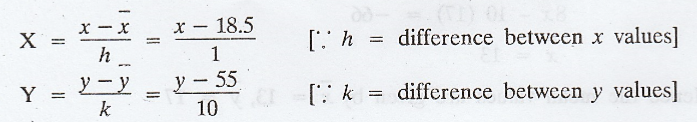
The
origin is taken as ![]() = 60
= 60
The
origin is taken as ![]() = 40
= 40
fx
-> sum of the each column
fy
-> sum of the each row
fxy
-> given frequency [in each cell upper values]
XY
-> In each cell middle values
XYfxy
-> In each cell sum of lower values
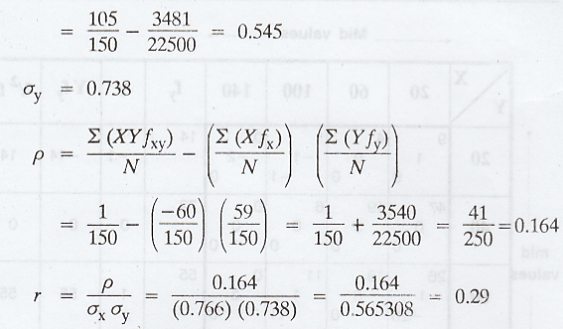
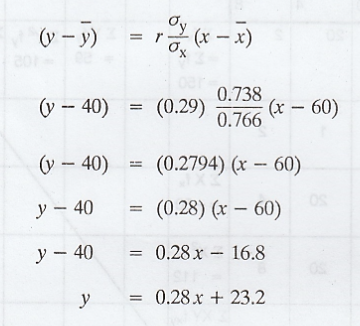
The
regression equation of y on x is
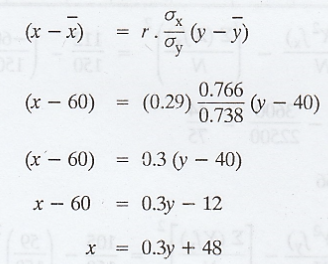
Note : The regression equation x on y is
Example 2.3.5
For
the following data find the most likely price at Madras corresponding to the
price 70 at Bombay and that at Bombay corresponding to the price 68 at Madras.
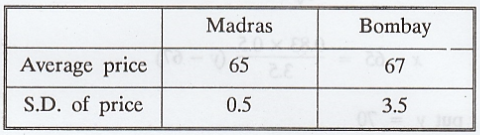
S.D.
of the difference between the price at Madras & Bombay is 3.1 ?[A.U. A/M.
2004] [A.U N/D 2017 R-08]
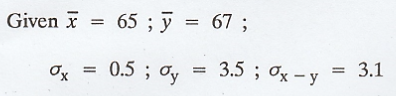
Solution:
Let
X denote the price at Madras and Y denotes the price at Bombay.
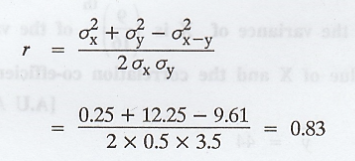
The
correlation co-efficient r is given by
The
line of regression of y on x is,
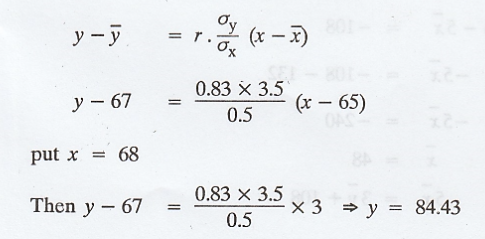
.'.
Corresponding to the price 68 at Madras, the most likely price at Bombay is
84.43.
Similarly
the line of regression of x on y is
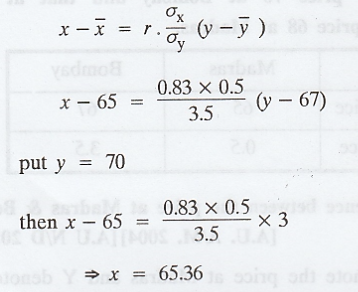
.'.
Corresponding to the price 70 at Bombay, the most likely price at Madras is
65.36.
Example 2.3.6
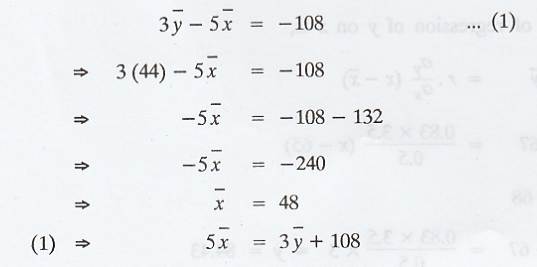
The
regression equation of X on Y is 3Y - 5X + 108 = 0. If the mean value of Y is
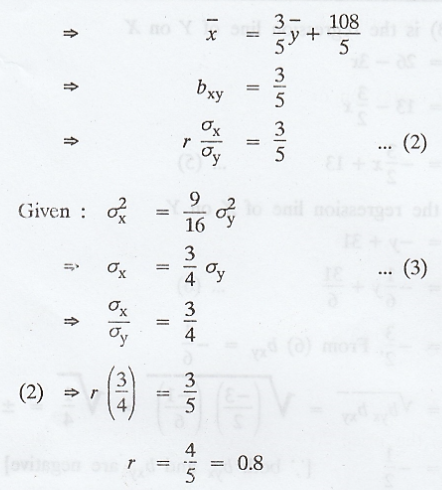
44 and the variance of X is (9/16)th of the variance of Y. Find the
mean value of X and the correlation co-efficient.
Solution:
Example 2.3.7
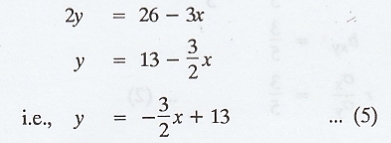
The
regression equations are 3x + 2y = 26 and 6x + y = 31. Find the correlation
coefficient between X and Y. [A.U N/D 2011] [A.U N/D 2017 (RP) R-13] [A.U A/M
2019 (R17) PS]
Solution:
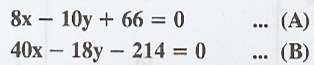
Given
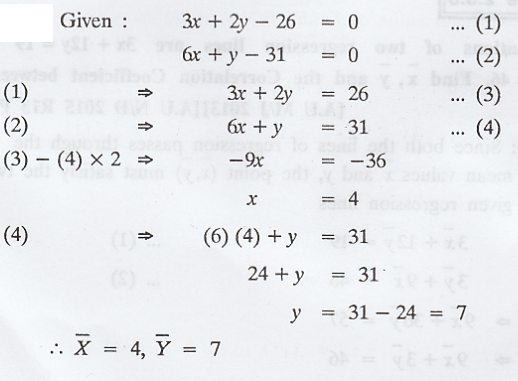
Assume
that (3) is the regression line of Y on X
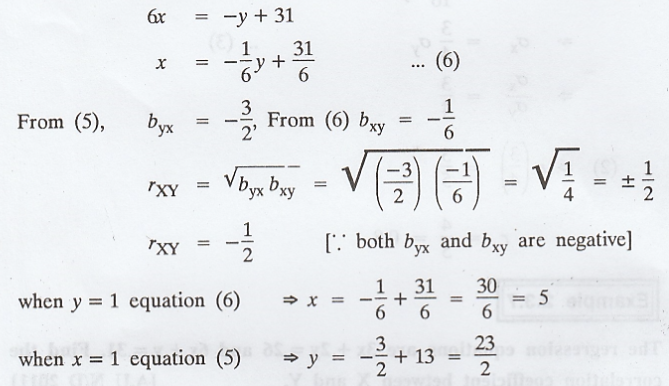
Assume
that (4) is the regression line of X on Y
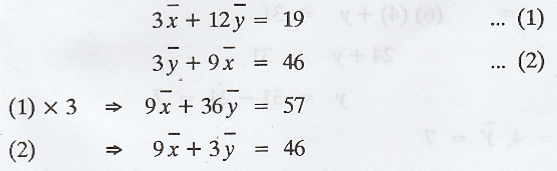
Example 2.3.8
The
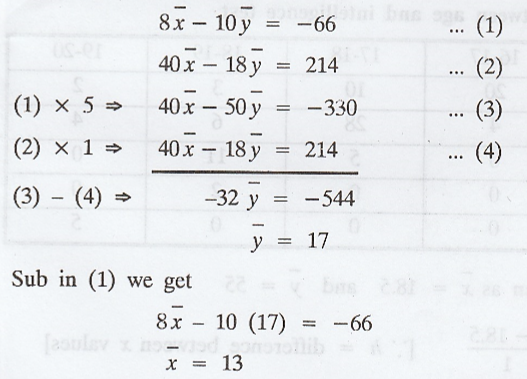
equations of two regression lines are 3x + 12y = 19 and 3y + 9x = 46. Find ,![]()
![]() and the Correlation Coefficient between X and Y. [A.U M/J 2013]
[A.U N/D 2015 R13 PQT]
and the Correlation Coefficient between X and Y. [A.U M/J 2013]
[A.U N/D 2015 R13 PQT]
Solution:
Since
both the lines of regression passes through the mean values ,![]()
![]() , the
point
, the
point ![]() must satisfy the two given regression lines
must satisfy the two given regression lines
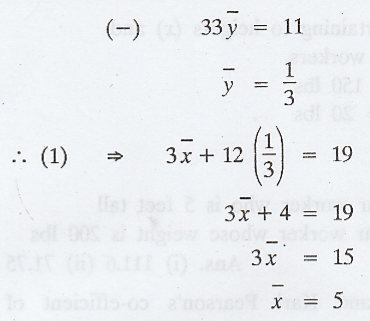
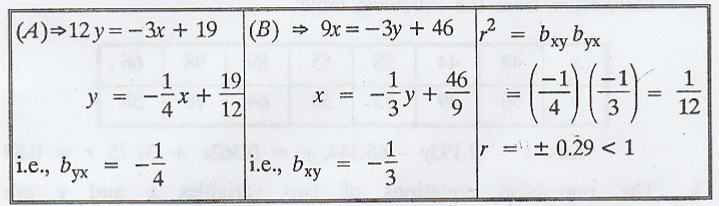
.'.
r = -0.29 ['.' both the regression coefficients are negative]
EXERCISE 2.3
1.
In a partially destroyed laboratory record, only the lines of regression of y
on x and x on y are available as 4x - 5y + 33 = 0 and 20x - 9y = 107
respectively, calculate  and the coefficient of correlation between x
and y.
and the coefficient of correlation between x
and y.
Ans.
r = ± 3/5
2.
The following table gives the data on rainfall (x inches) and discharge in a
certain river (y units). Obtain the line of regression- of y on x. Estimate
from it, the discharge corresponding to a rainfall of 2 inches.
3.
The following are results pertaining to heights (x) and weights (y) of 1000
industrial workers.
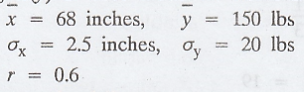
Estimate
the following
(i)
The weight of a particular worker who is 5 feet tall
(ii)
The height of a particular worker whose weight is 200 lbs Ans. (i) 111.6 (ii)
71.75
4.
Find the regression lines and Karl Pearson's co-efficient of correlation from
the following table.
Ans.
x = 2.195y - 65.344, y = 0.363x + 37.75,
r = 0.89
5.
The regression equations of two and y are x = 0.7y+ 5.2 and y = 0.3x + 2.8.
Find the means of the variables and the co-efficient of correlation between
them. Ans. r = 0.458
6.
The two regression lines are 3x + 2y = 26 and 6x + 3y = 31. Find the
correlation co-efficient. Ans. r = -0.866
7.
Given that 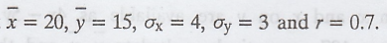 Find the two To in regression equations and find the
value of y when x = 24. Ans. y = 17.1
Find the two To in regression equations and find the
value of y when x = 24. Ans. y = 17.1
8.
The coefficient of correlation between two variables x and y is 0.8 and the
regression co-efficient of y on x is 1.6. If ![]() = 22,
= 22, ![]() = 20. Find
the regression co-efficient of x on y and the two regression equations.
= 20. Find
the regression co-efficient of x on y and the two regression equations.
Ans.
Regression equation of x on y: x = 0.4y + 14, Regression equation of y on x: y
= 1.6x - 15.2
9.
If the equations of the two lines of regression of y on x and x on y are
respectively, 7x - 16y + 9= 0; 5y - 4x - 3 = 0, calculate the co-efficient of
correlation, ![]() and
and ![]() . [AU, May, '99]
. [AU, May, '99]
Random Process and Linear Algebra: Unit II: Two-Dimensional Random Variables,, : Tag: : - Regression
Related Topics
Related Subjects
Random Process and Linear Algebra
MA3355 - M3 - 3rd Semester - ECE Dept - 2021 Regulation | 3rd Semester ECE Dept 2021 Regulation